Getting started
Install
Windows
- Download the installer.
- Ignore "Unknown publisher" warnings (we're working on this).
- Follow the instructions of the installer.
- Sign in from the VKtracer app.
Linux
- Download the AppImage.
- Make it executable:
chmoad a+x VKtracer.AppImage. - Run the AppImage.
- Sign in from the VKtracer app.
Refer Limitations and Troubleshooting sections of the documentation.
Subscription
To use VKtracer you need to have an active subscription. We offer a 32-day free trial. To activate a paid subscription or free trial, visit your account page. In the app, you can review the current status of the subscription from the main menu. Click Subscription menu item to re-check subscription status.
Basics
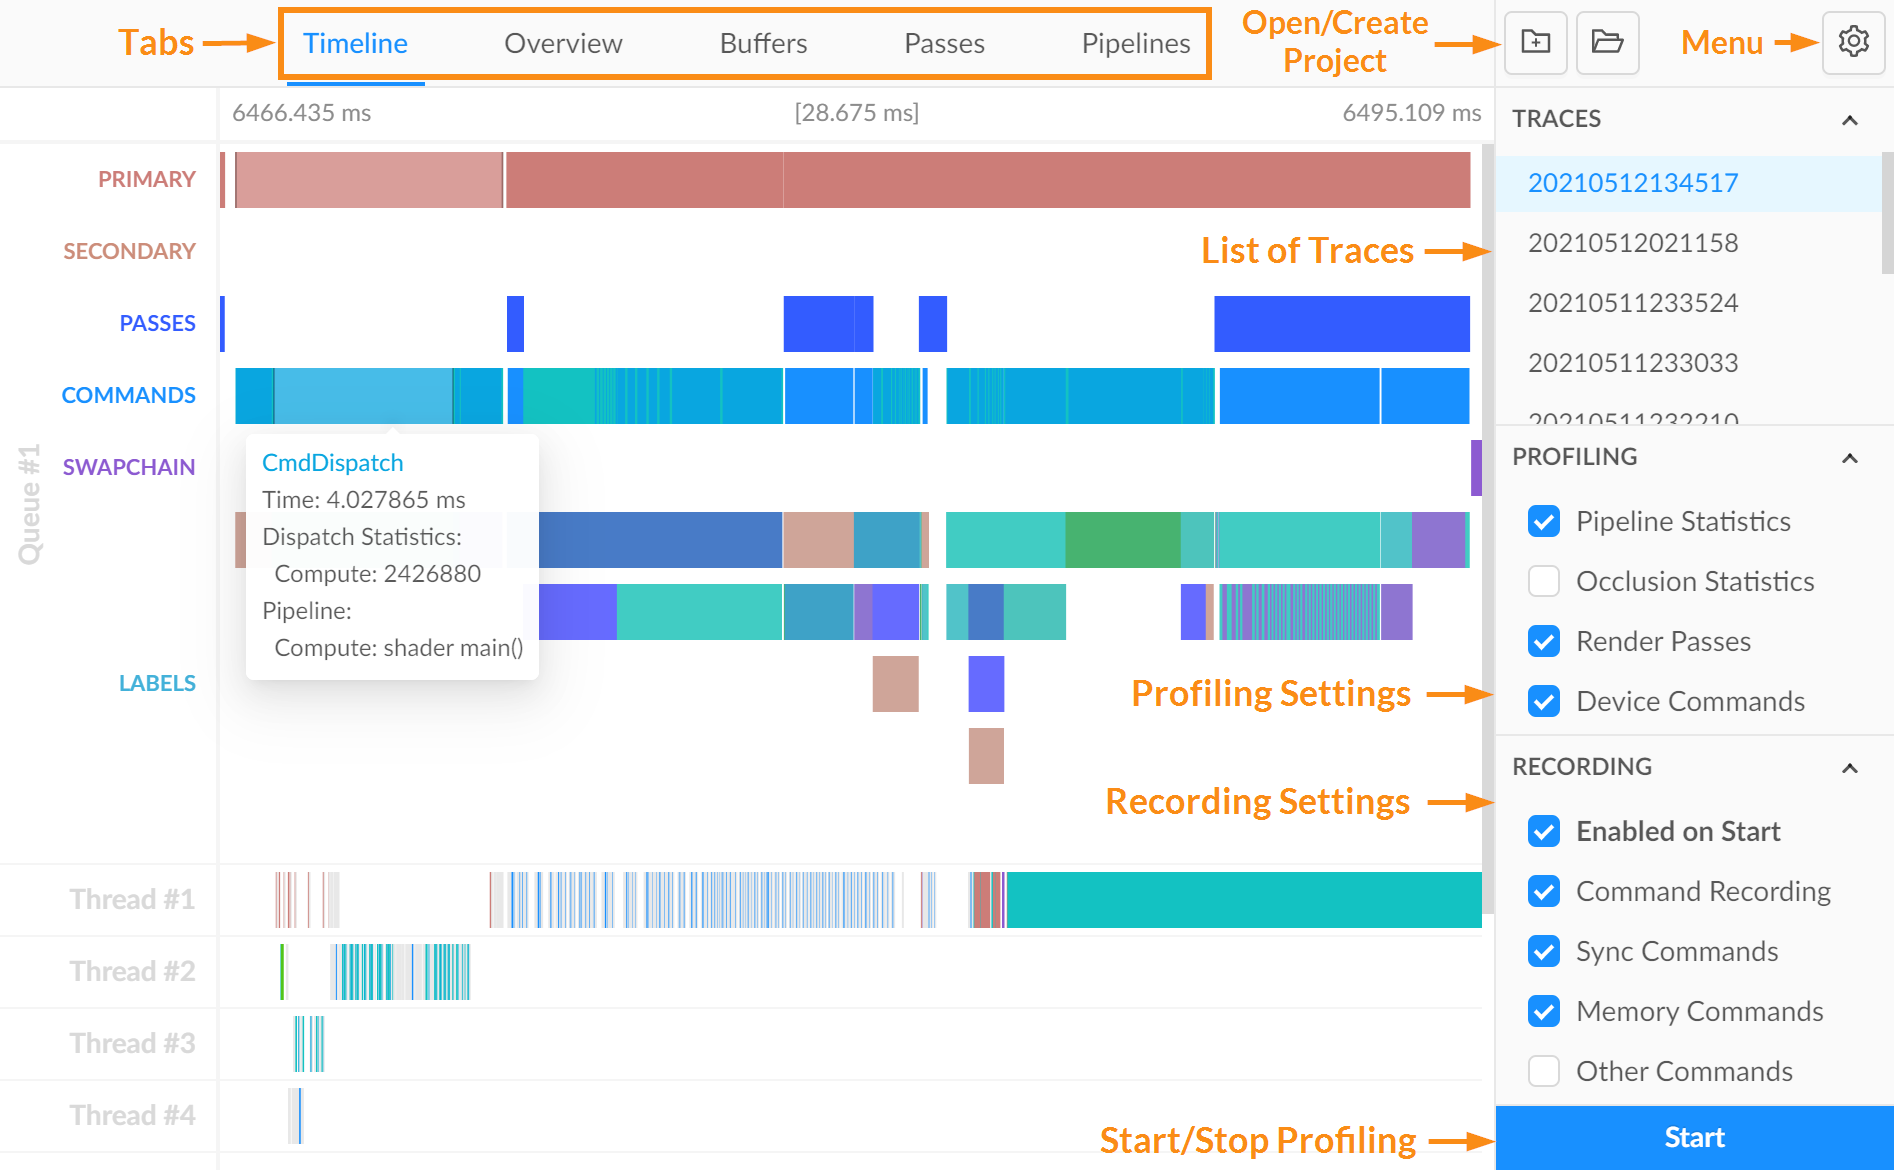
The picture shows the interface of VKtracer:
Project
To create a new project, press the corresponding button, and fill in the form.
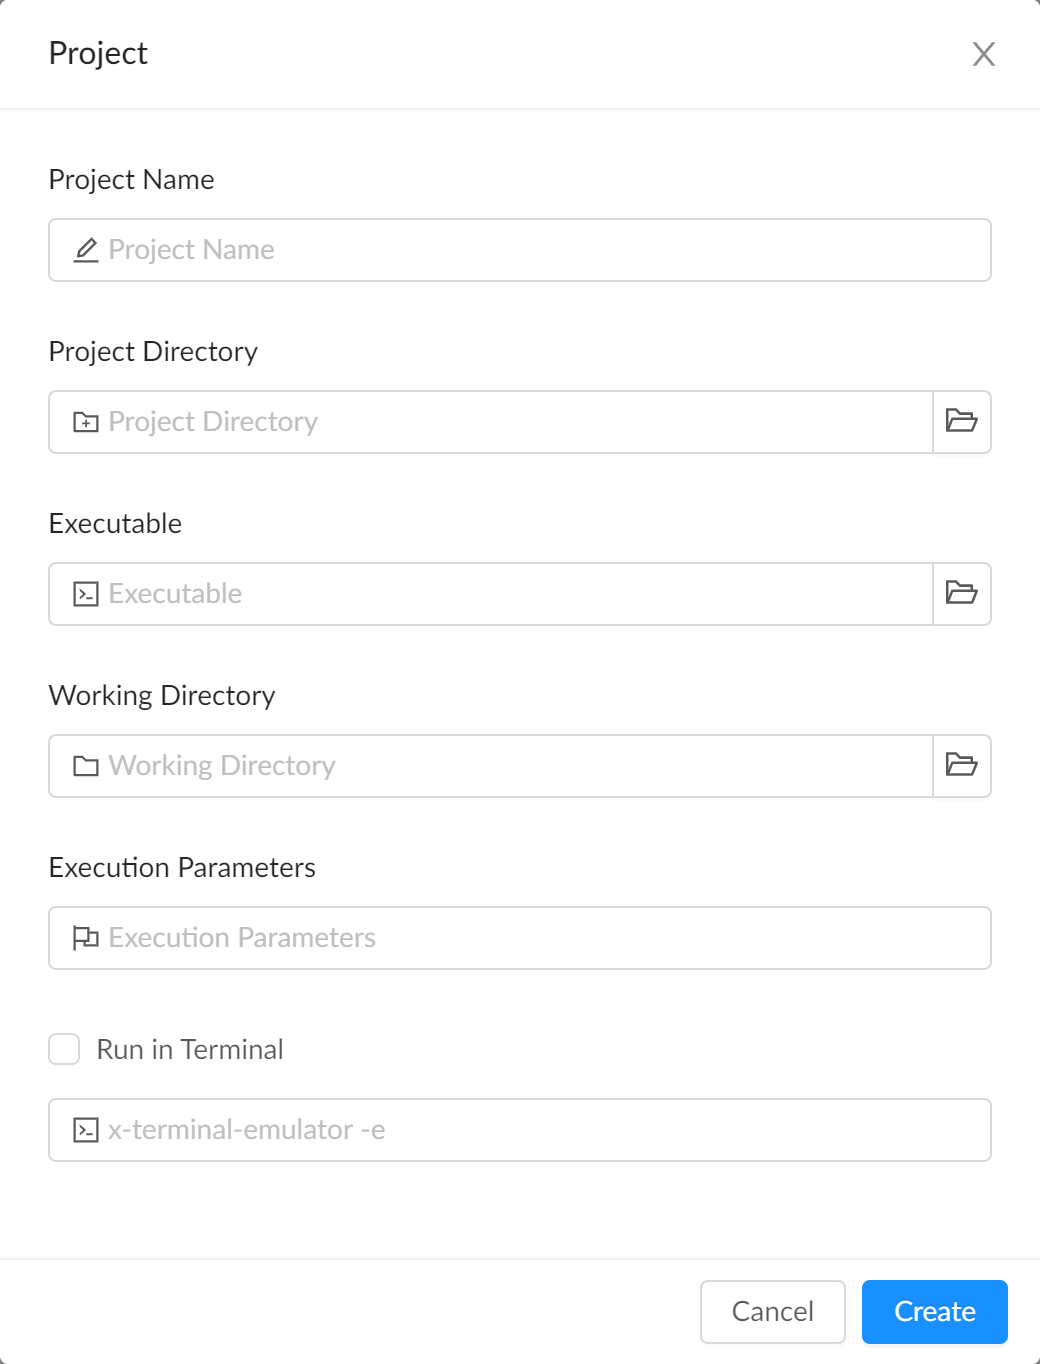
Provide the following information:
- Name and directory of the project.
- Executable - application you would like to profile.
- Optionally: working directory (by default directory of the executable).
- Command line arguments/flags.
- Whether to run the profiled application in a terminal.
- On Linux, command to run the application in a terminal.
You can change the working directory, flags, and terminal options at any time in project settings, available from the main menu.
For most Linux distros the default command to run the app in terminal (x-terminator-emulator -e) works fine. It will use the default terminal emulator. You can override it, e.g. gnome-terminal -e. Note, that when profiling in a terminal emulator, VKtracer cannot handle application exit and show a meaningful warning in case anything is wrong. If you experience any issue when running in a terminal, first try to uncheck this option and try to profile again.
Profiling
Press the "Start" button to begin application profiling. Once the application closes - profiling is finished and the trace is opened. You can select the current trace in a list on the right. Here you can also delete or rename any trace through its context menu.
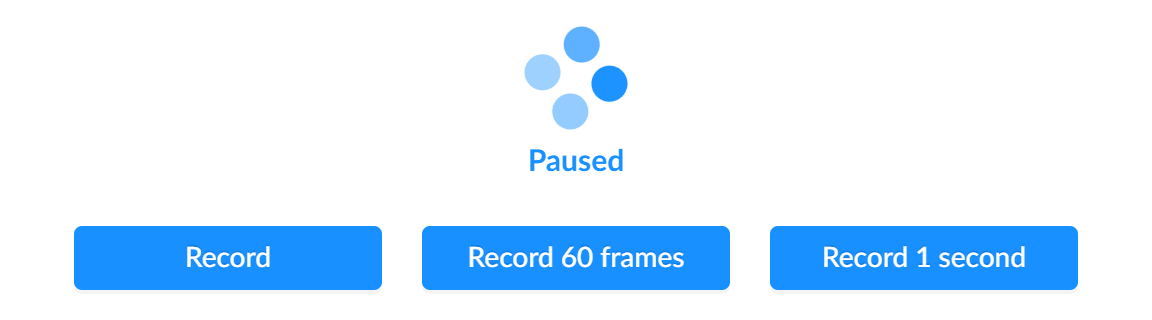
During profiling, you can start and stop trace recording anytime. You can also record the next 60 frames or the next second.
Two sub-menus in the sidebar provide profiling and recording options.
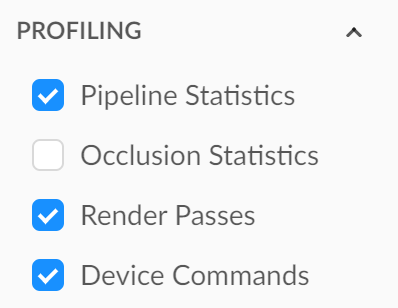
Profiling settings:
- Pipeline Statistics - collect pipeline metrics (number of input primitives, shaded vertices, clipped primitives).
- Occlusion Statistics - collect occlusion metrics (number of samples that pass the per-fragment tests).
- Render Passes - enable/disable profiling of render passes.
- Device Commands - enable/disable profiling of commands (draw, memory, sync).
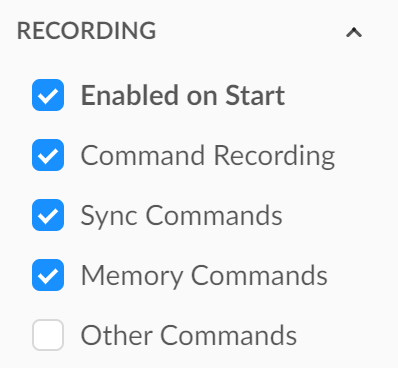
Recording settings:
- Enabled on Start - start profiling and recording at the same time.
- Command Recording - record Vulkan functions.
- Sync Commands - record sync functions.
- Memory Commands - record memory functions.
- Other Commands - record misc functions.
By disabling the collection of metrics and profiling of device commands or render passes one can reduce the overhead of VKtracer. Disabling the recording of commands reduces size of a trace and speeds up timeline rendering. If you would like to profile several frames or time interval we recommend to disable recording on start to skip initialization phase and don't record boilerplate.
We recommend that your application exits normally by itself to finish profiling. You can use the "Stop" button but in this case, trace can be truncated. First, VKtracer will try to gracefully close the application using taskkill (WM_CLOSE message) on Windows or kill (SIGTERM signal) on Linux. If the application doesn't close after 5 seconds timeout, VKtracer will forcefully terminate it by taskkill /f (WM_QUIT message) on Windows or kill -9 (SIGKILL signal) on Linux. If the profiled application doesn't properly close on WM_CLOSE/SIGTERM, profiling information may be lost.
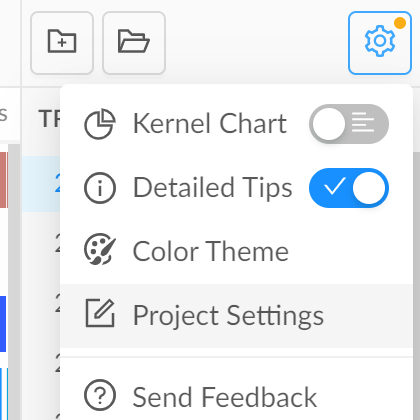
Main menu
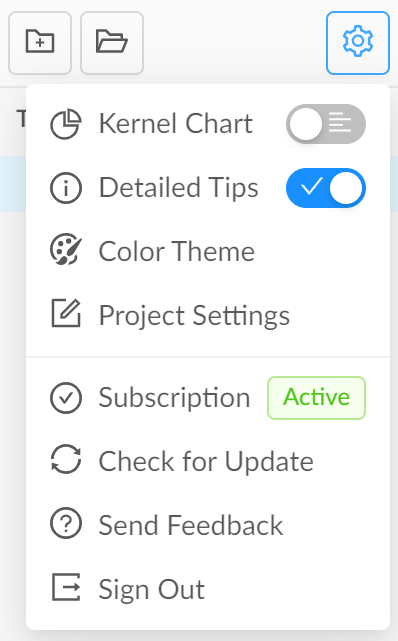
From the main menu you can:
- Change type of metrics charts (bar or pie).
- Enable detailed tooltip on hover.
- Select color theme (light, dark, system).
- Change project configuration (working directory and flags).
- Sign in/out.
- Check your subscription status.
- Check for updates.
- Update VKtracer when a new version is available.
- Send feedback.
Tabs
Finally, there are 5 tabs providing trace data:
- Timeline - timeline of Vulkan commands.
- Overview - overview metrics (occupancy, utilization, fps).
- Metrics - metrics per command buffers, render passes and pipelines.
Timeline
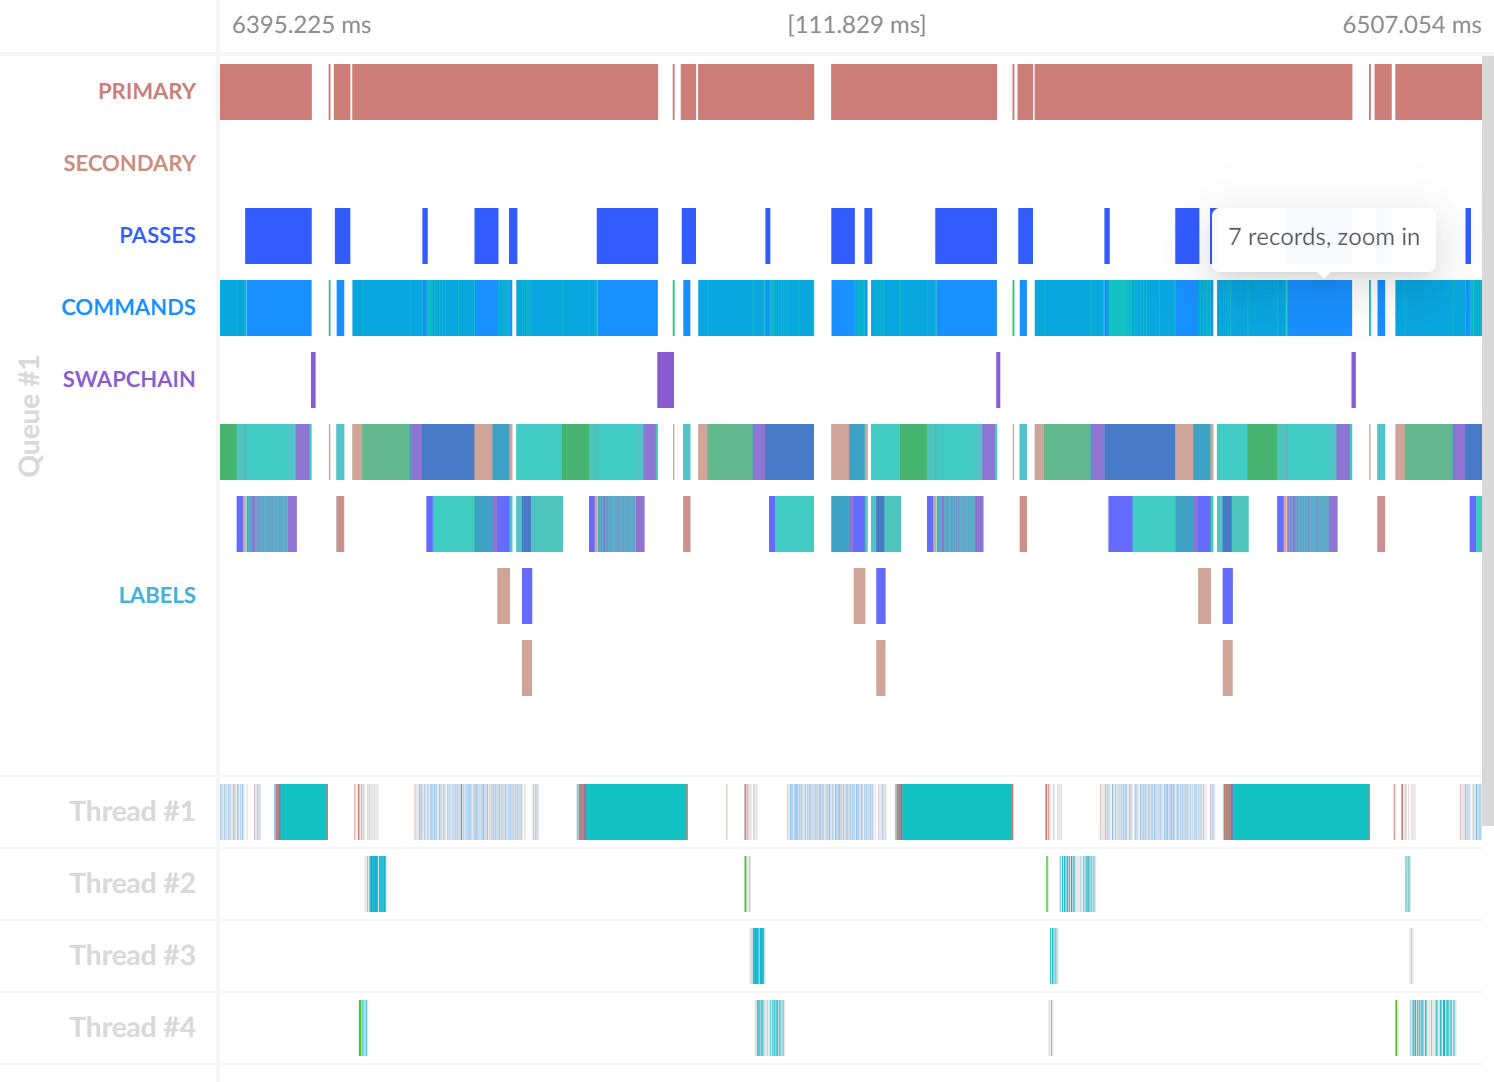
Timeline is the most useful tool for analysis of Vulkan rendering and computational workflow. Easy to understand visualization provides deep insight into how your pipeline actually works. You can find out what time is taken by each operation, render pass, command buffer, or review particular sequence, check order and dependency chain, find bottlenecks and stalls, analyze GPU utilization, determine whether computation capabilities of the device are fully utilized. Timeline allows you to zoom in up to every detail, and at the same time gives you a bird’s eye view of how your application works. So you can explore it at both coarser and finer scales. The timeline view is pixel-perfect, highly responsive, and provides smooth experience even when there are millions of Vulkan commands recorded.
Basics
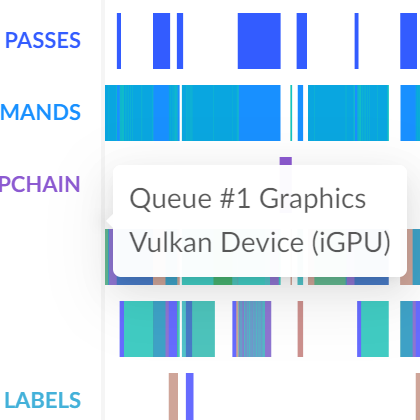
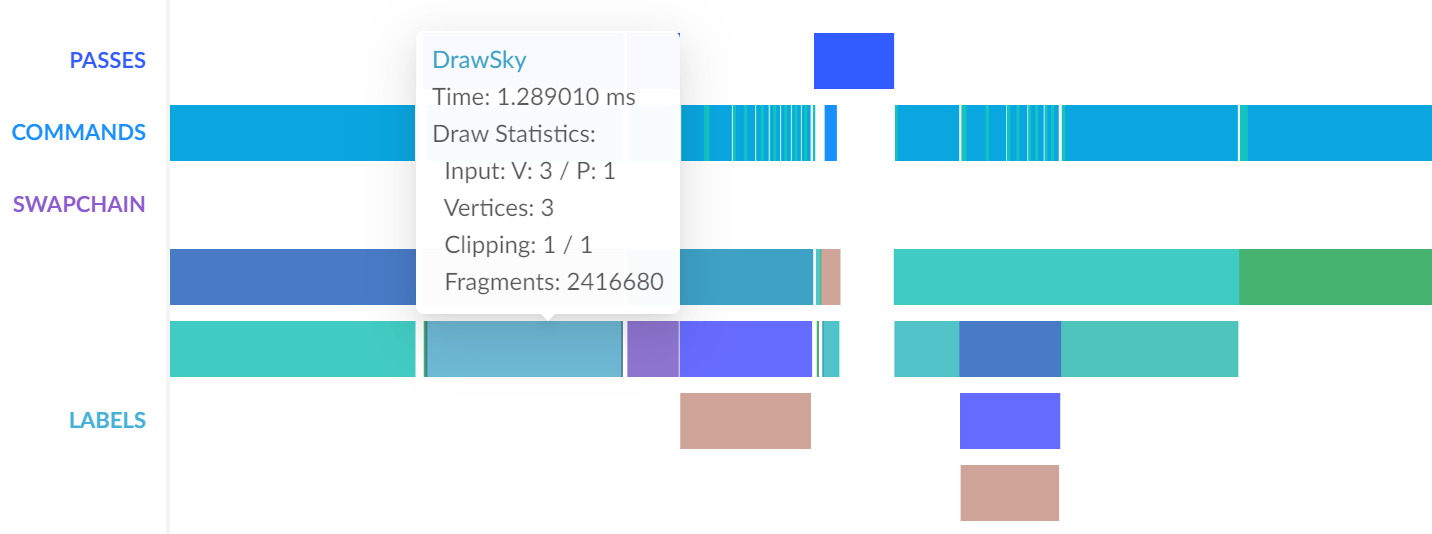
The next picture shows the basic elements of the timeline view.
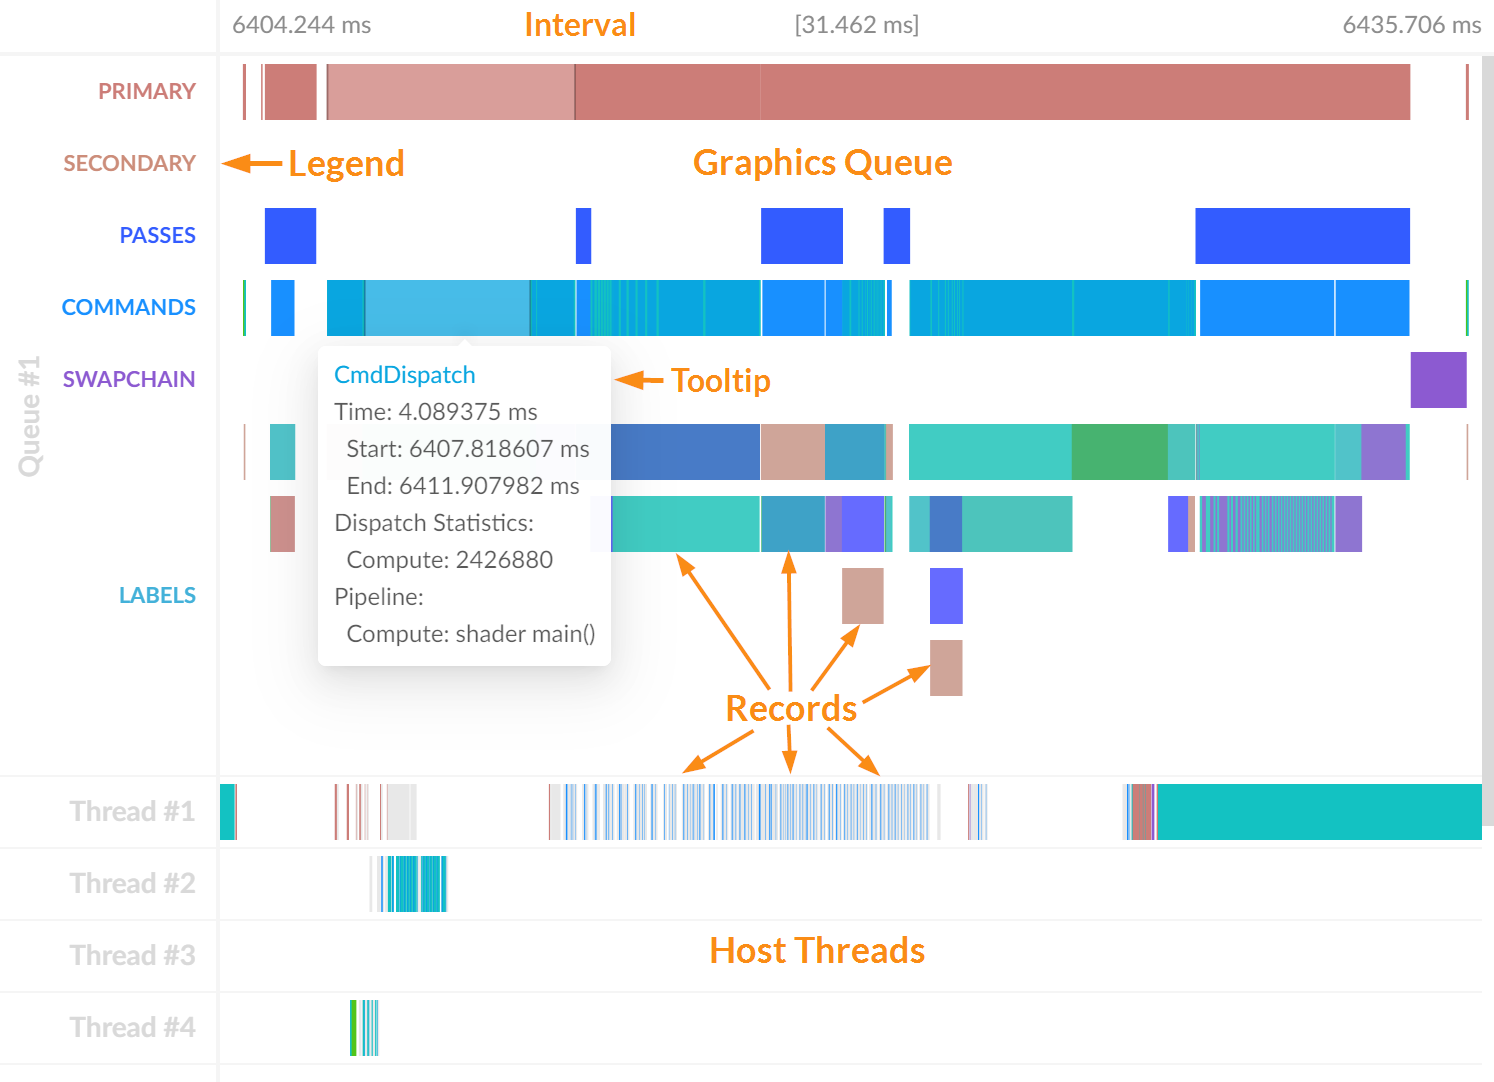
Timeline presents every Vulkan operation (record) executed by an application on both host and device sides. VKtracer records both device and host timings, as well as relevant workload metrics when corresponding options are enabled. There are separate lanes for each device queue and host thread. For device queues operations are hierarchically grouped by their types: Command Buffers, Render Passes, Device Commands, Swapchain, and Labels. The current interval and its duration are shown at the top, legend - at the left.
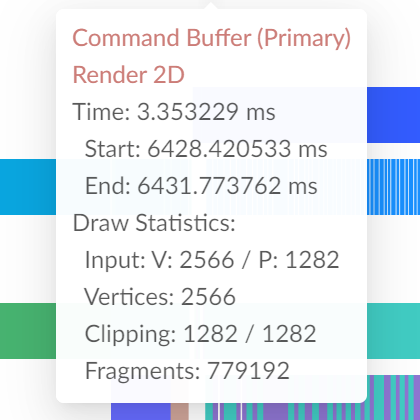
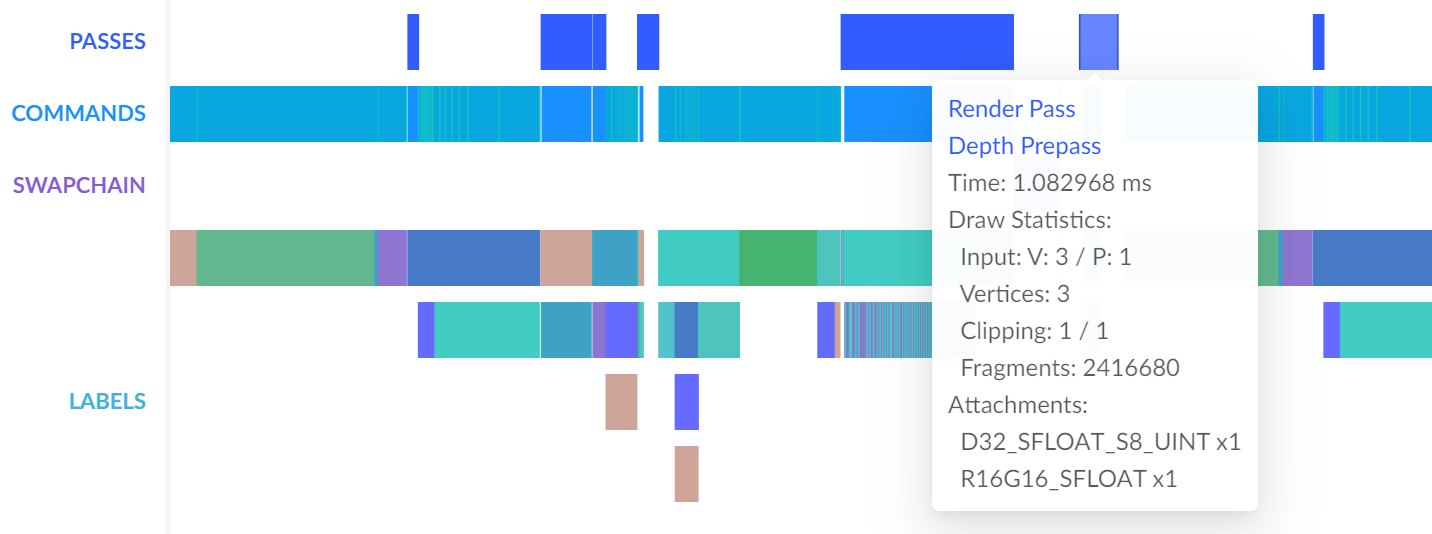
On record hover, a tooltip with detailed information is shown, and the record itself is highlighted in both device and host lanes. For command buffers and device commands tooltips provide timings and workload metrics. Render pass tooltips additionally show a collection of attachments. If underlying object has been provided with a name by vkSetDebugUtilsObjectNameEXT() it's included in a header.
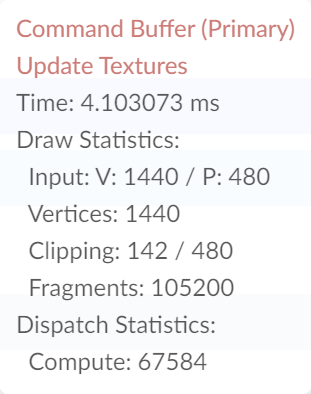
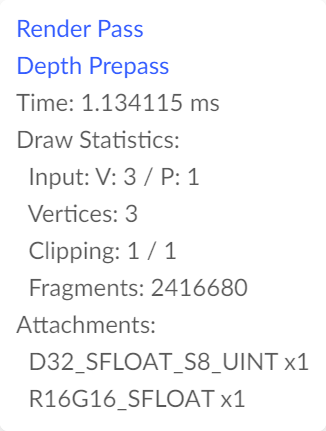
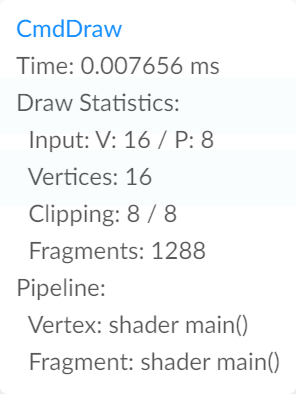
You can choose between essential and detailed tooltip information in application settings. By hovering a device queue in a legend, you can get the name of the corresponding GPU.
Control
Here we will explain how to control the viewport time interval in the timeline. In fact, it's intuitive and easy, it's very similar to that in image editing apps.
- Use a mouse wheel to zoom in/out.
- To scroll, you can use either a scrollbar or mouse wheel with Ctrl.
- Hold the left mouse button and drag to translate.
- When zooming or translating the time point under the cursor stays at the same place.
- With Ctrl modifier, you can select a time interval you are interested in.
- On release of the mouse button, the selected interval becomes the current viewport.
- If you release Ctrl prior to the mouse button, nothing will happen. This can be used for quick time measurements.
- Double-click on Command Buffer, Render Pass, or Label record aligns viewport with this record.
- Double-click on vkQueuePresent adjusts viewport to the corresponding frame, i.e. time interval between this vkQueuePresent and the previous.
- Double-click on vkAcquireNextImage in host thread timeline adjusts viewport to the corresponding frame, i.e. interval between this vkAcquireNextImage and the next.
- Double-click on Command Buffer with Shift modifier focuses viewport between corresponding vkBeginCommandBuffer and vkEndCommandBuffer commands.
Overview
Overview tab shows overall aggregated performance statistics of the time interval currently shown on the timeline. The notable feature of VKtracer is that all views are synchronized and metrics are provided for the same time interval. This allows analyzing different stages of the rendering or computation workflow. You can explore an app at both coarser and finer scales, review metrics for the whole application, one frame, down to a single command buffer, render pass, or even command.
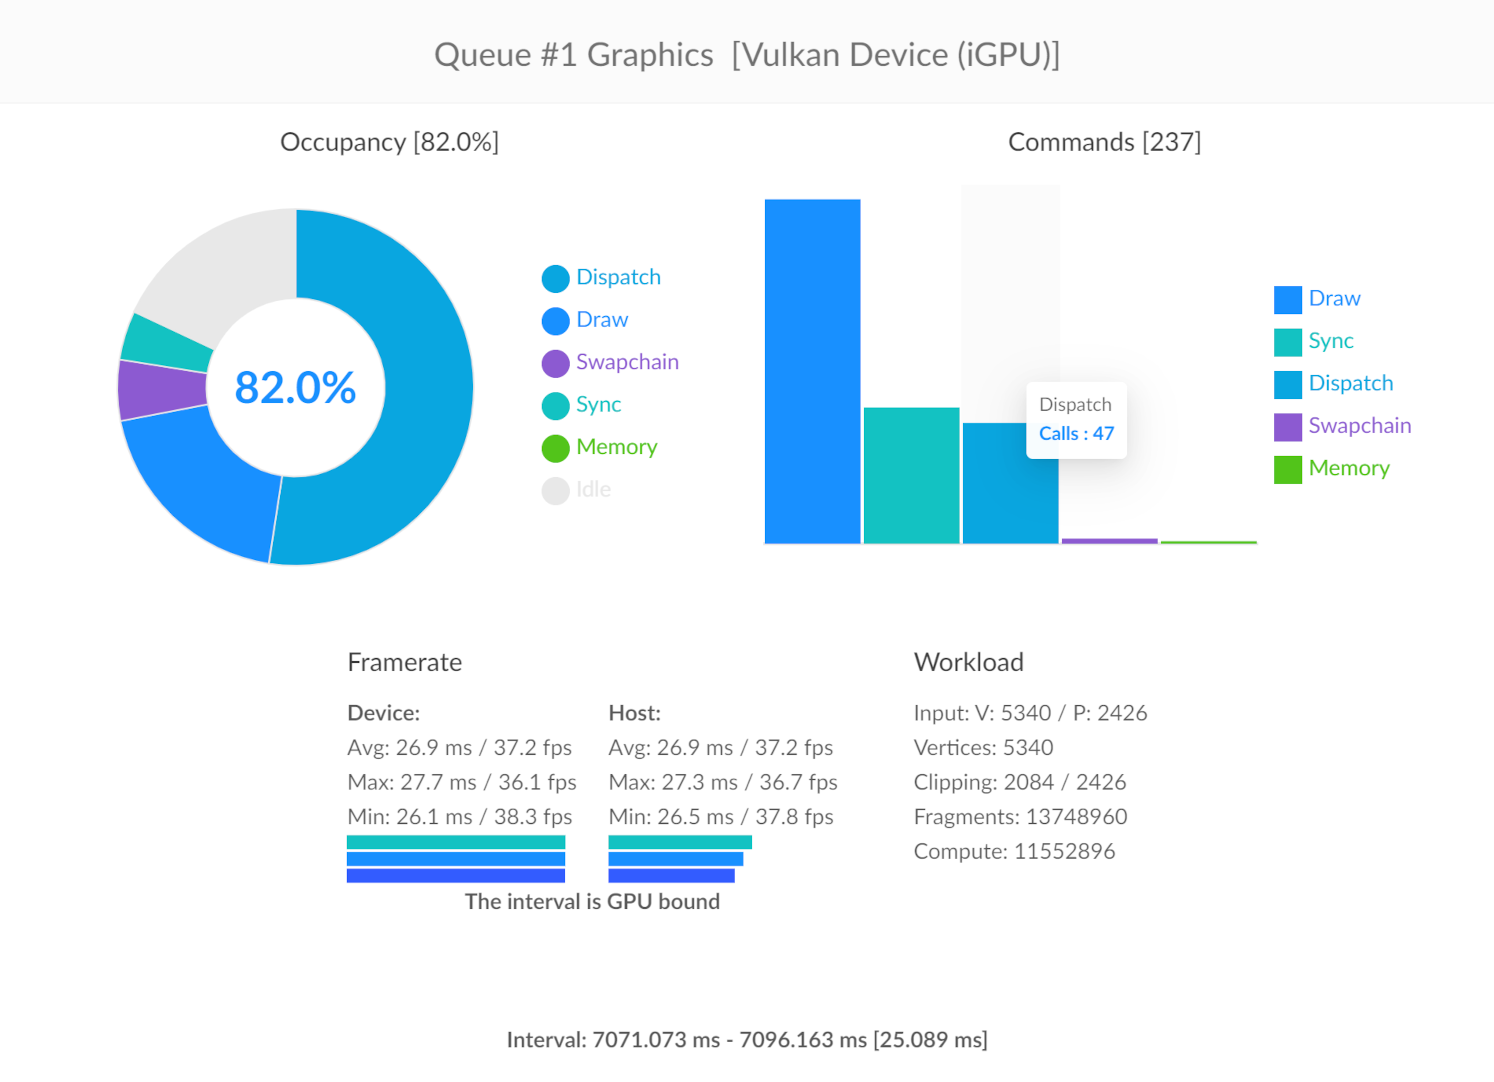
Occupancy
Occupancy charts how much time is spent on each type of workload and time GPU was idle. This shows how efficiently your app utilizes device resources. The lower idle time, the better utilization of the corresponding device. The distribution between workloads gives insight into where to look for optimization opportunities. Either it's draw/dispatch pipelines, memory transfers, or synchronization stalls. The bar chart presents a number of commands submitted to the queue per workload type.
Frame Rate
The frame rate section provides information about frame timings and device/host activity. For the host side, the frame time is an interval between two consecutive vkAcquireNextImage and for the device - between vkQueuePresent commands. For the current time interval shown on the timeline average, minimum and maximum frame times and FPS are evaluated.
Activity
The next are charts of device and host activity. This is the percentage of time between frames spent on the actual work. The device is assumed to be inactive between the end of the latest vkQueuePresent and the start of the next command buffer submitted to a queue. The host is inactive while waits for the next swapchain image to become available (vkAcquireNextImage) or waits for command buffer to finish execution (vkWaitForFences, vkDeviceWaitIdle, vkQueueWaitIdle, etc). Then there's a comparative interpretation of device and host activities that determines which side is a bottleneck. If the device is active most of the time the interval is considered to be GPU bound. Otherwise, if the host's activity is higher than 90% - CPU bound. If both are idle for more than 20% - there's no bottleneck.
Workload
Workload section shows total statistics accumulated for the current time interval:
- Number of input primitives and vertices.
- Number of shaded vertices and fragments.
- Number of primitives generated by geometry shader.
- Number of patched processed by tesselation shader.
- Number of compute shader invocations.
- Number of samples that passed all per-fragment tests.
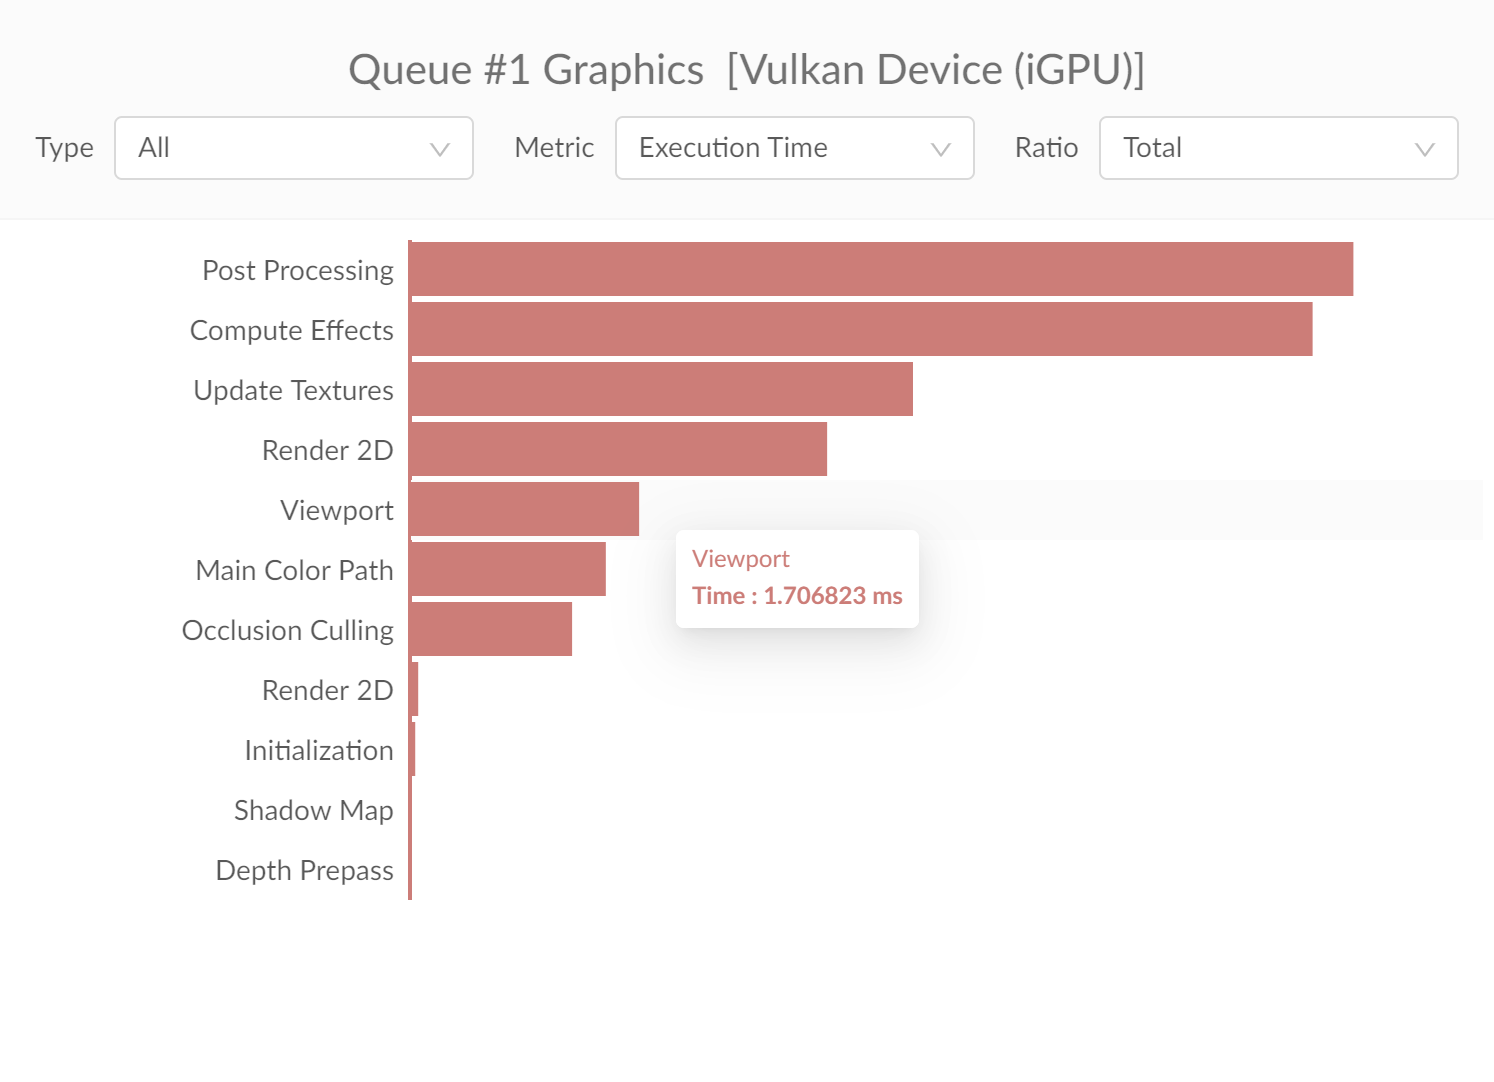
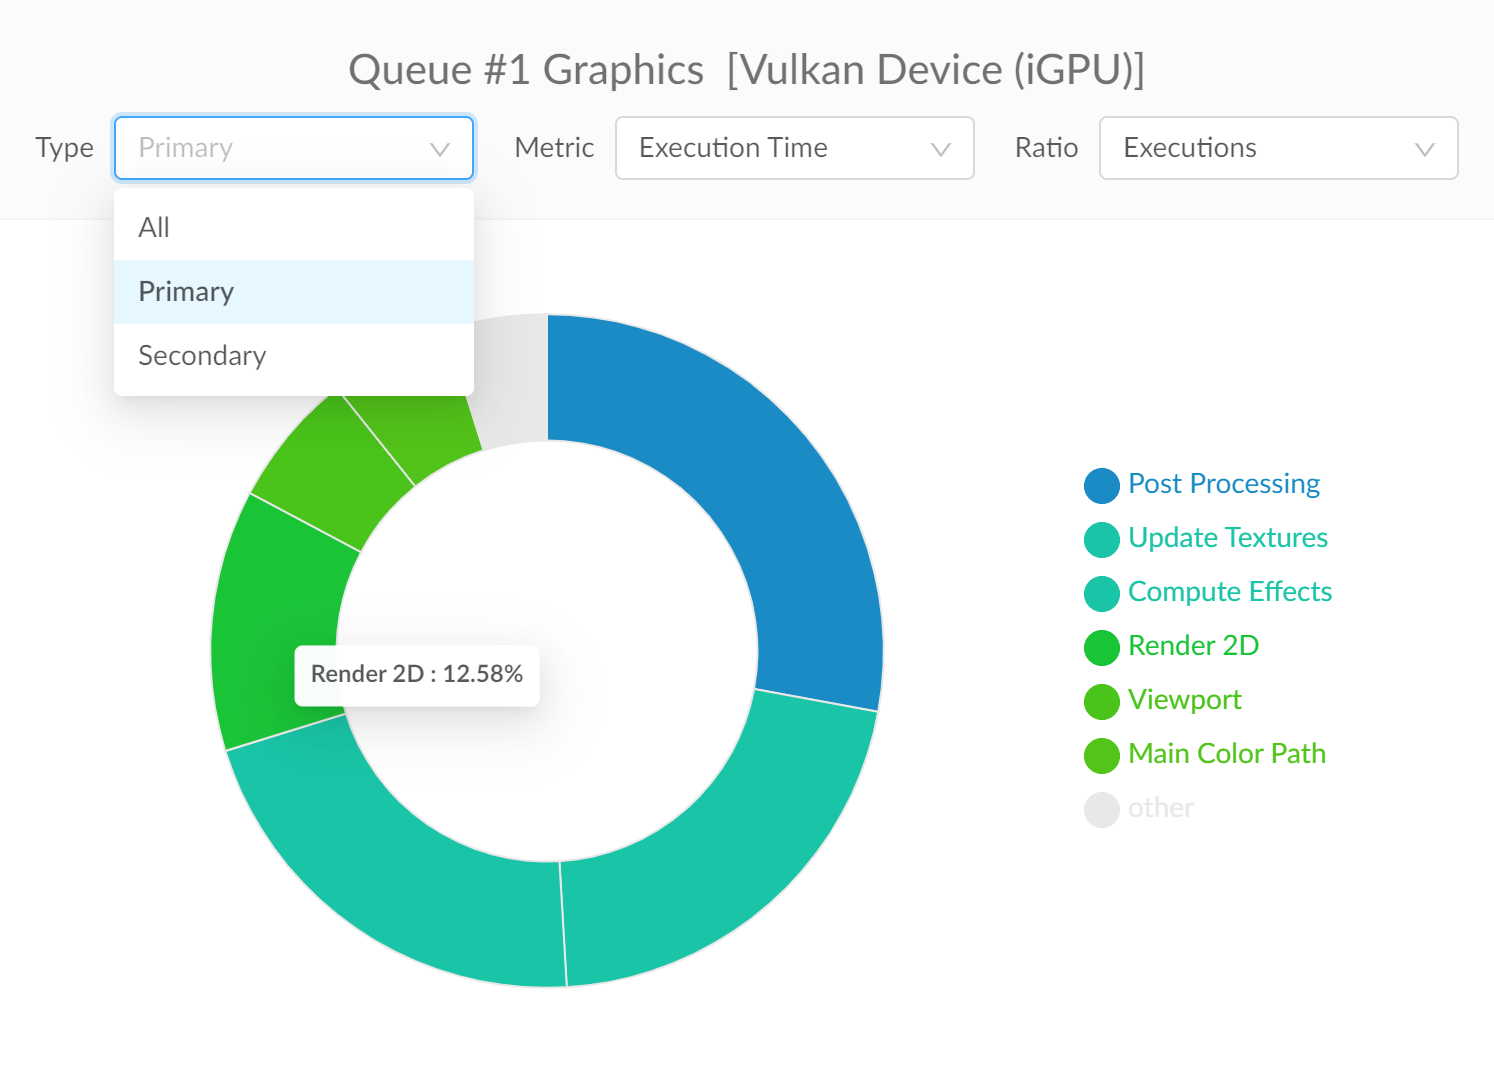
Metrics
During profiling VKtracer collects workload metrics of every command buffer, render pass, and device command execution. This option can be enabled/disabled in PROFILING sub-menu of the sidebar. The notable feature of VKtracer is that all views are synchronized and metrics are provided for the same time interval.
The next metrics can be collected:
- Number of input primitives and vertices.
- Number of shaded vertices and fragments.
- Number of primitives generated by geometry shader.
- Number of patched processed by tesselation shader.
- Number of compute shader invocations.
- Number of primitives the passed clipping stage.
- Number of samples that passed all per-fragment tests.
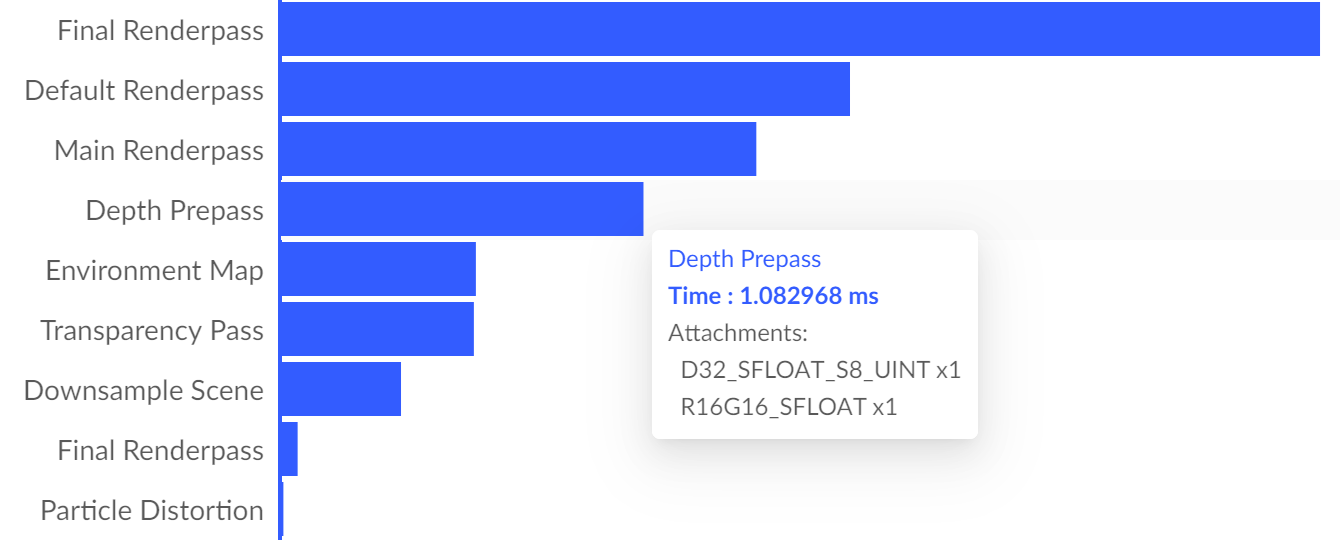
There are 3 tabs: for command buffers, render passes, and device commands. Each tab presents metrics per object of the corresponding type accumulated for the time interval. Device command metrics are accumulated per the corresponding pipeline object. At the top, you can select a metric of interest. You can also evaluate the value of one metric ratio another, e.g. average time per execution, the number of vertices shaded per second, or the number of primitives passed the clipping stage ratio the number of primitives generated by geometry shaders. Objects can be filtered by their type, e.g. primary and secondary command buffers or draw, dispatch, or ray tracing commands. You can switch between bar and pie chart representations in the main menu.
Labels
Labels help developers to annotate sections of a pipeline. They are useful to group commands into logical portions of the algorithm. Labels support hierarchical nesting which is handy in complex scenarios. Vulkan has support for debug labels through the [VK_EXT_debug_utils] (https://www.khronos.org/registry/vulkan/specs/1.2-extensions/man/html/VK_EXT_debug_utils.html) extension.
To insert label you need to record vkCmdBeginDebugUtilsLabelEXT and vkCmdEndDebugUtilsLabelEXT commands into command buffer. You can also submit vkQueueBeginDebugUtilsLabelEXT and vkQueueEndDebugUtilsLabelEXT to queue to annotate group of submissions. VkDebugUtilsLabelEXT specifies parameters of a label, like name and color.
Debug labels are presented on the timeline having specified color and name.
Another useful tool provided by extension and supported by VKtracer is object names. A user-defined name can be assigned to object by calling vkSetDebugUtilsObjectNameEXT. Assigned names will be shown in timeline tooltips on hover and in metrics views. In case sections of rendering are logically group into command buffers and render passes you can replace labels by simply assigning meaningful names to objects.
Miscellaneous
Tests
We've successfully tested VKtracer with the following games and engines:
Limitations
- Currently, not all vendor extension are supported. Apps using these extensions are profiled as usual but extension API won't be traced, presented on the timeline, and contribute to metrics. If you need the support of any extension, please contact us.
- Only 64-bit applications are supported at the moment.
Troubleshooting
- On Linux, if timeline rendering is too slow, try to start VKtracer from the command line with --ignore-gpu-blacklist flag.
- On Linux, VKtracer requires at least glibc 2.25, so older versions of some Linux distributions may not be supported. You can query glibc version by ldd --version. We are working on support of older distributions in production builds. Meanwhile, you can contact us and we will send you insider build.
- On Windows, if VKtracer window is empty on the start, ensure Visual C++ Redistributable 2019 is installed.